A summarization.
My school has this thing called project week, which is where you choose whatever and do a project on it. Simple. In 2019, I did a project where I logged all fish counts from 3/4 day boats from Dana Wharf. I made some graphs and charts. Now, I did a project doing the same thing - logging it from 2021. I compared using variables such as water temperature. Take a look at the graphs. I made the graphs, logged the information, etc. Thought you would be interested. All information is taken from Dana Wharf Sportfishing and Whale Watching.

Fish categories:
Whitefish (Ocean Whitefish Caulolatilus princeps)
Rockfish (all species of sebastinae caught excluding Vermillion Rockfish. Also includes Lingcod.)
Vermillion (Vermillion Rockfish Sebastes miniatus)
Sculpin (California Sculpin Scorpaena guttata )
All Basses (Includes Calico Bass, Barred Sand Bass, and White Sea Bass. Also including California Sheepshead)
Flatfishes (Includes Pacific Sanddab, Halibut, and Rock Sole)
Pelagic (Includes Skipjack Tuna, Yellowfin Tuna, Pacific Bluefin Tuna, Dorado, Yellowtail Tuna, Jack Mackerel, Barracuda)
Misc. (Finescale Triggerfish, Thresher Shark, Pinback Shark, Tomcod, Blacksmith)
This is graph A. Graph A is so kind enough to compare the percentages of fish caught in 2019 and 2021. For example, 8% of fish caught in 2019 were Whitefish. 12.4% of fish caught were Whitefish in 2021.
Let's look at the most increased fish groups. Pelagic fish increased by almost 1300%. 29 caught in 2019 and 396 in 2021. Why? Pelagic fish come here to feed, and I believed that warmer water could've brought more baitfish to feed on. That wasn't the case.

This water temperature is from a buoy southeast of Long Beach, close to Dana Point. This is the surface water temperature on average per month. You can see that 2019 is wayyy higher than 2021. If there were higher temperatures, why less fish?
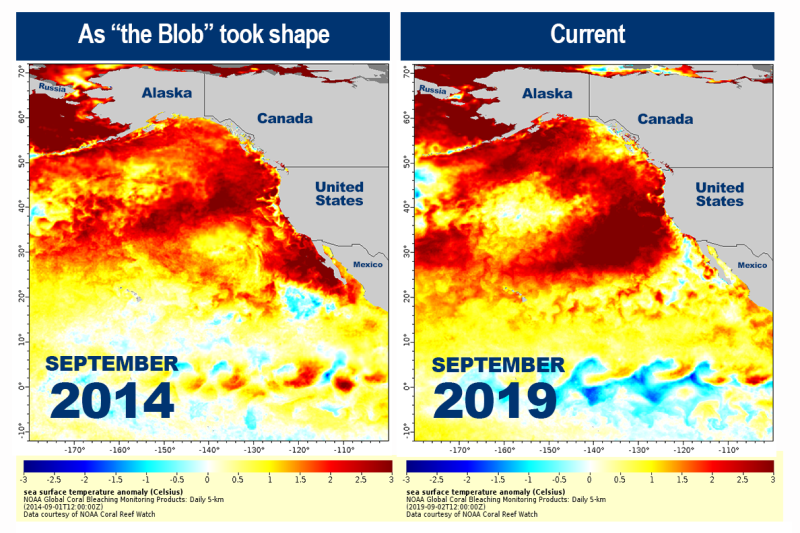
Turns out, in 2019, there was a marine heatwave that hit California. The water temperature was highest quite a ways away from the channel islands, where pelagic fish are caught often. Above is a graph is taken from the NOAA website. You can see the intensity of the heat. You can also see that the water temperature is highest farther away from shore. I would guess that this is where the tuna and baitfish would be - outside of the range of 3/4 day boats.
The marine heatwave also sprouted toxic algae, which killed shore fish such as croakers, but it could've affected kelp beds where fish such as Calico Bass, Sand Bass, and Sheepshead live.

Vermillion Rockfish almost decreased by half! From 37% to 21%. Take a look at the graph. It shows the average Vermillion Rockfish per angler in the month. Normally, we would see a bowl shape, but it seems October, November, and December seemed to have messed everything up. I didn't do enough research to figure out why, but the California Department of Fish and Wildlife seems to agree with the results I got.
The bag limit is normally you can kee 10 rockfish of any species besides a few. You can keep 5 Vermillion Rockfish out of 10 Rockfish. The CDFW and IUCN decreased the bag limit to 4/10 rockfish.
You can also see that although there were less anglers in 2021, 2019 was a better year overall
 2019
2019
 2021
2021
 2021 pie chart
 2019 pie chart
My school has this thing called project week, which is where you choose whatever and do a project on it. Simple. In 2019, I did a project where I logged all fish counts from 3/4 day boats from Dana Wharf. I made some graphs and charts. Now, I did a project doing the same thing - logging it from 2021. I compared using variables such as water temperature. Take a look at the graphs. I made the graphs, logged the information, etc. Thought you would be interested. All information is taken from Dana Wharf Sportfishing and Whale Watching.
Fish categories:
Whitefish (Ocean Whitefish Caulolatilus princeps)
Rockfish (all species of sebastinae caught excluding Vermillion Rockfish. Also includes Lingcod.)
Vermillion (Vermillion Rockfish Sebastes miniatus)
Sculpin (California Sculpin Scorpaena guttata )
All Basses (Includes Calico Bass, Barred Sand Bass, and White Sea Bass. Also including California Sheepshead)
Flatfishes (Includes Pacific Sanddab, Halibut, and Rock Sole)
Pelagic (Includes Skipjack Tuna, Yellowfin Tuna, Pacific Bluefin Tuna, Dorado, Yellowtail Tuna, Jack Mackerel, Barracuda)
Misc. (Finescale Triggerfish, Thresher Shark, Pinback Shark, Tomcod, Blacksmith)
This is graph A. Graph A is so kind enough to compare the percentages of fish caught in 2019 and 2021. For example, 8% of fish caught in 2019 were Whitefish. 12.4% of fish caught were Whitefish in 2021.
Let's look at the most increased fish groups. Pelagic fish increased by almost 1300%. 29 caught in 2019 and 396 in 2021. Why? Pelagic fish come here to feed, and I believed that warmer water could've brought more baitfish to feed on. That wasn't the case.
This water temperature is from a buoy southeast of Long Beach, close to Dana Point. This is the surface water temperature on average per month. You can see that 2019 is wayyy higher than 2021. If there were higher temperatures, why less fish?
Turns out, in 2019, there was a marine heatwave that hit California. The water temperature was highest quite a ways away from the channel islands, where pelagic fish are caught often. Above is a graph is taken from the NOAA website. You can see the intensity of the heat. You can also see that the water temperature is highest farther away from shore. I would guess that this is where the tuna and baitfish would be - outside of the range of 3/4 day boats.
The marine heatwave also sprouted toxic algae, which killed shore fish such as croakers, but it could've affected kelp beds where fish such as Calico Bass, Sand Bass, and Sheepshead live.
Vermillion Rockfish almost decreased by half! From 37% to 21%. Take a look at the graph. It shows the average Vermillion Rockfish per angler in the month. Normally, we would see a bowl shape, but it seems October, November, and December seemed to have messed everything up. I didn't do enough research to figure out why, but the California Department of Fish and Wildlife seems to agree with the results I got.
The bag limit is normally you can kee 10 rockfish of any species besides a few. You can keep 5 Vermillion Rockfish out of 10 Rockfish. The CDFW and IUCN decreased the bag limit to 4/10 rockfish.
You can also see that although there were less anglers in 2021, 2019 was a better year overall